Profitability
| 2021/3 | 2022/3 | 2023/3 | 2024/3 | 2025/3 | |
|---|---|---|---|---|---|
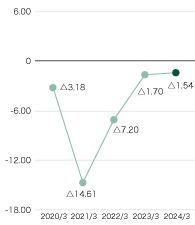
| Ratio of Operating Income to Net Sales (%) | △14.61 | △7.20 | △1.70 | △1.54 | △0.22 |
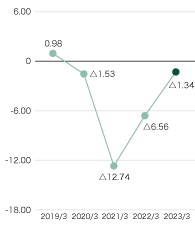
| Ratio of Ordinary Income to Net Sales (%) | △12.74 | △6.56 | △1.34 | △1.17 | △0.81 |
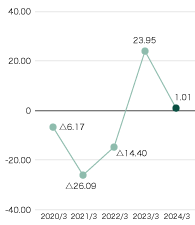
| Ratio of Net Income to Net Sales (%) | △26.09 | △14.40 | 23.95 | 1.01 | △8.68 |
Ratio of Operating Income to Net Sales
(%)
Ratio of Ordinary Income to Net Sales
(%)
Ratio of Net Income to Net Sales
(%)
Stability
| 2021/3 | 2022/3 | 2023/3 | 2024/3 | 2025/3 | |
|---|---|---|---|---|---|
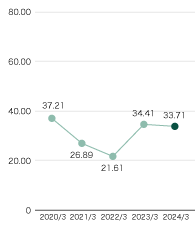
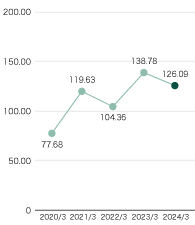
| Equity Ratio (%) | 26.89 | 21.61 | 34.41 | 33.71 | 30.49 |
| Current Ratio (%) | 119.63 | 104.36 | 138.78 | 126.09 | 141.58 |
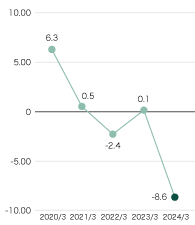
| Interest Coverage Ratio (Times) | 0.5 | -2.4 | 0.1 | -8.6 | 1.7 |
Note: Interest Coverage Ratio = Cash Flows from Operating Activities / Amount of Interest Paid
Equity Ratio
(%)
Current Ratio
(%)
Interest Coverage Ratio
(Times)
Efficiency
| 2021/3 | 2022/3 | 2023/3 | 2024/3 | 2025/3 | |
|---|---|---|---|---|---|
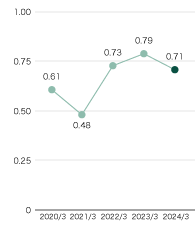
| Total Asset Turnover (Times) | 0.48 | 0.73 | 0.79 | 0.71 | 0.73 |
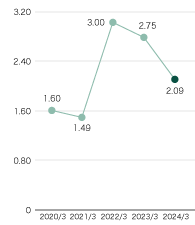
| Net Assets Turnover (Times) | 1.49 | 3.00 | 2.75 | 2.09 | 2.27 |
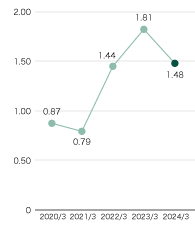
| Fixed Asset Turnover (Times) | 0.79 | 1.44 | 1.81 | 1.48 | 1.39 |
Note: Total Assets, Net Assets and Fixed Assets are calculated from the averages of the beginning and the end of the period.
Total Asset Turnover
(Times)
Net Assets Turnover
(Times)
Fixed Asset Turnover
(Times)
Productivity
| 2021/3 | 2022/3 | 2023/3 | 2024/3 | 2025/3 | |
|---|---|---|---|---|---|
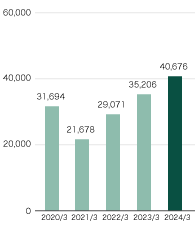
| Net Sales per Employee (Thousands of Yen) | 21,678 | 29,071 | 35,206 | 40,676 | 47,682 |
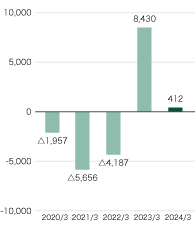
| Net Income per Employee (Thousands of Yen) | △5,656 | △4,187 | 8,430 | 412 | △4,138 |
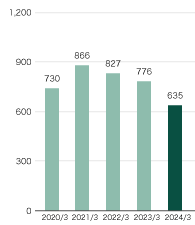
| Number of Employees (Persons) | 866 | 827 | 776 | 635 | 565 |
Note: Net Sales per Employee and Net Income per Employee are calculated based on the average number of employees during the period.
Net Sales per Employee
(Thousands of Yen)
Net Income per Employee
(Thousands of Yen)
Number of Employees
(Persons)
Cash Flows
| 2021/3 | 2022/3 | 2023/3 | 2024/3 | 2025/3 | |
|---|---|---|---|---|---|
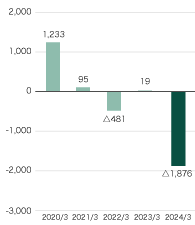
| Cash Flows from Operating Activities (Millions of Yen) | 95 | △481 | 19 | △1,876 | 500 |
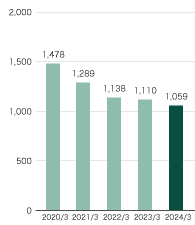
| Depreciation Expense (Millions of Yen) | 1,289 | 1,138 | 1,110 | 1,059 | 1,152 |
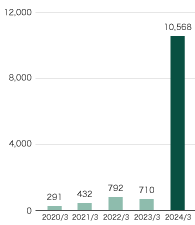
| Capital Expenditure (Millions of Yen) | 432 | 792 | 710 | 10,568 | 838 |
Cash Flows from Operating Activities
(Millions of Yen)
Depreciation Expense
(Millions of Yen)
Capital Expenditure
(Millions of Yen)
Investment Indices
| 2021/3 | 2022/3 | 2023/3 | 2024/3 | 2025/3 | |
|---|---|---|---|---|---|
| Return on Equity [ROE] (%) | △38.9 | △43.2 | 65.8 | 2.1 | △19.7 |
| Return on Assets[ROA] (%) | △6.1 | △4.8 | △1.1 | △0.8 | △0.6 |
Note: Total Assets and Shareholders' Equity are calculated from the averages of the beginning and the end of the period.
Return on Equity[ROE]
(%)
![Return on Equity[ROE]](image/img_indices_16.gif)
Return on Assets[ROA]
(%)
![Return on Assets[ROA]](image/img_indices_17.gif)


